Understanding Overall Accuracy and Error Bars in Machine Learning
The formula for **F1-Score** is:
$$ \text{F1-Score} = 2 \times \frac{\text{Precision} \times \text{Recall}}{\text{Precision} + \text{Recall}} $$
In machine learning, assessing a model’s performance is crucial for understanding how well it generalizes to new, unseen data. One of the most common ways to evaluate a model's performance is by calculating its accuracy. However, accuracy alone doesn't give us the full picture—it's also important to measure the uncertainty around this value. This is where error bars come into play.
In this post, we’ll dive into how to calculate overall accuracy and the margin of error (or error bars) in the context of machine learning. By the end, you’ll understand how to interpret these values and how they provide insight into your model’s true performance.
What is Overall Accuracy?
Overall accuracy is the most straightforward metric for evaluating a classification model. It tells us the proportion of data points that the model correctly classifies. Mathematically, it’s defined as:
Accuracy=Number of Correct PredictionsTotal Number of Predictions\text{Accuracy} = \frac{\text{Number of Correct Predictions}}{\text{Total Number of Predictions}}Accuracy=Total Number of PredictionsNumber of Correct Predictions
For example, suppose you have 100 validation data points, and your model correctly classifies 90 of them. The overall accuracy would be:
Accuracy=90100=0.9or90%\text{Accuracy} = \frac{90}{100} = 0.9 \quad \text{or} \quad 90\%Accuracy=10090=0.9or90%
While this value gives us a quick sense of how well the model performed, it only tells part of the story. In real-world scenarios, the true accuracy may vary slightly due to random fluctuations or inherent variability in the data. This is why we need to calculate the error bar, which helps us quantify the uncertainty around the accuracy estimate.
What Are Error Bars (Margin of Error)?
An error bar represents the uncertainty in a measurement. In the context of machine learning, it helps us understand how much the accuracy value might fluctuate due to the inherent variability in the validation set.
The error bar is particularly useful when comparing different models or evaluating the performance of a single model across multiple runs or subsets of data. It tells us not only the point estimate (overall accuracy) but also the range within which the true performance might lie.
How Do You Calculate the Error Bar?
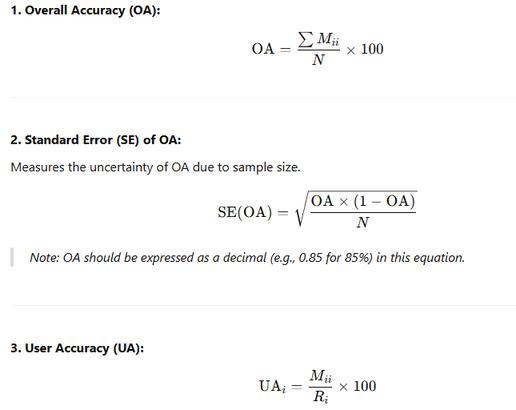
The error bar for overall accuracy is calculated using the standard error of the proportion of correct predictions. This can be derived from the binomial distribution, which is used for binary outcomes (correct vs. incorrect predictions).
The formula for the standard error (SE) is:
Standard Error=p(1−p)n\text{Standard Error} = \sqrt{\frac{p(1 - p)}{n}}Standard Error=np(1−p)
Where:
-
ppp is the proportion of correct classifications (accuracy).
-
1−p1 - p1−p is the error rate (proportion of incorrect classifications).
-
nnn is the total number of data points in the validation set.
Step-by-Step Example:
Let’s go through an example to calculate the overall accuracy and error bar:
Suppose we have:
-
100 validation data points.
-
The model correctly classifies 90 of them (i.e., 90% accuracy).
-
Therefore, incorrect classifications are 100−90=10100 - 90 = 10100−90=10.
1. Calculate Overall Accuracy:
Accuracy=90100=0.9or90%\text{Accuracy} = \frac{90}{100} = 0.9 \quad \text{or} \quad 90\%Accuracy=10090=0.9or90%
2. Calculate the Error Bar:
The error bar is based on the standard error of the accuracy. We use the formula:
Standard Error=0.9×0.1100=0.09100=0.0009=0.03\text{Standard Error} = \sqrt{\frac{0.9 \times 0.1}{100}} = \sqrt{\frac{0.09}{100}} = \sqrt{0.0009} = 0.03Standard Error=1000.9×0.1=1000.09=0.0009=0.03
3. Interpret the Margin of Error:
The margin of error is the value of the standard error, which in this case is 0.03. To interpret this, we simply apply the margin of error to the overall accuracy:
Accuracy=0.9±0.03\text{Accuracy} = 0.9 \pm 0.03Accuracy=0.9±0.03
This means that the model’s true overall accuracy could range between 87% and 93% with a 95% confidence level. In other words, if we were to run the model on different subsets of the data, the accuracy would likely fall somewhere within this range.
Why Are Error Bars Important?
1. Confidence in Model Performance:
Error bars provide a sense of how stable or reliable your model's accuracy is. A smaller error bar suggests that the model's performance is consistent and reliable across different data subsets, while a larger error bar indicates more variability and uncertainty.
2. Comparing Models:
When comparing different models, it’s not enough to simply look at which one has the highest accuracy. A model with a high accuracy but a large error bar might not be as reliable as another model with a slightly lower accuracy but a smaller error bar. The error bar helps you make more informed decisions about model selection.
3. Better Decision-Making:
In real-world applications, understanding the range of possible outcomes (rather than just the point estimate) can help in decision-making. For example, in critical areas like medical diagnoses, having a confidence interval for accuracy helps assess the risks involved in model predictions.
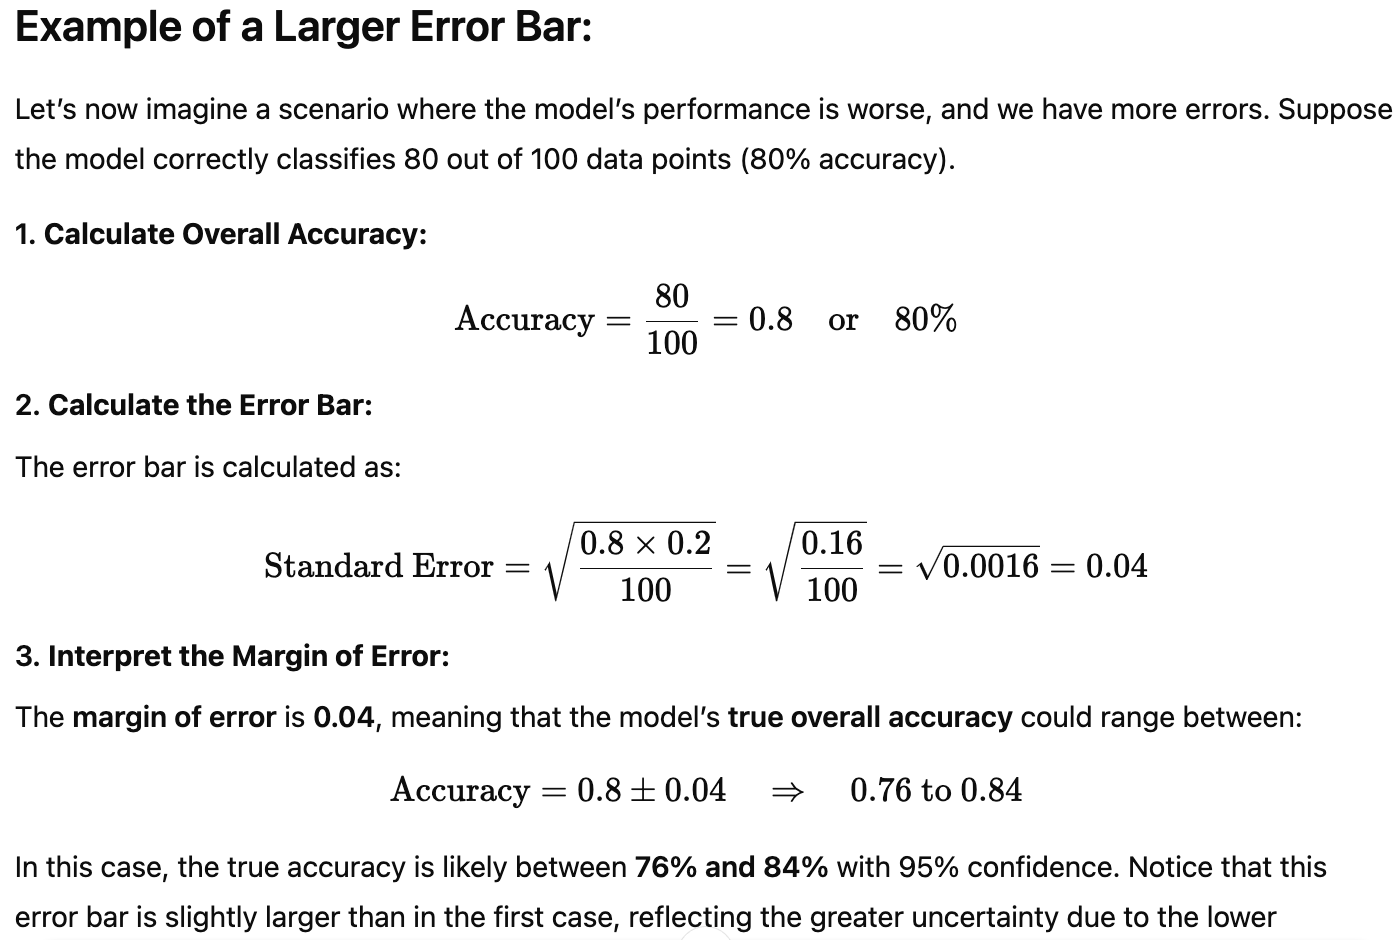
Example of a Larger Error Bar:
Let’s now imagine a scenario where the model’s performance is worse, and we have more errors. Suppose the model correctly classifies 80 out of 100 data points (80% accuracy).
1. Calculate Overall Accuracy:
Accuracy=80100=0.8or80%\text{Accuracy} = \frac{80}{100} = 0.8 \quad \text{or} \quad 80\%Accuracy=10080=0.8or80%
2. Calculate the Error Bar:
The error bar is calculated as:
Standard Error=0.8×0.2100=0.16100=0.0016=0.04\text{Standard Error} = \sqrt{\frac{0.8 \times 0.2}{100}} = \sqrt{\frac{0.16}{100}} = \sqrt{0.0016} = 0.04Standard Error=1000.8×0.2=1000.16=0.0016=0.04
3. Interpret the Margin of Error:
The margin of error is 0.04, meaning that the model’s true overall accuracy could range between:
Accuracy=0.8±0.04⇒0.76 to 0.84\text{Accuracy} = 0.8 \pm 0.04 \quad \Rightarrow \quad 0.76 \text{ to } 0.84Accuracy=0.8±0.04⇒0.76 to 0.84
In this case, the true accuracy is likely between 76% and 84% with 95% confidence. Notice that this error bar is slightly larger than in the first case, reflecting the greater uncertainty due to the lower accuracy.


0% Positive Review (0 Comments)