
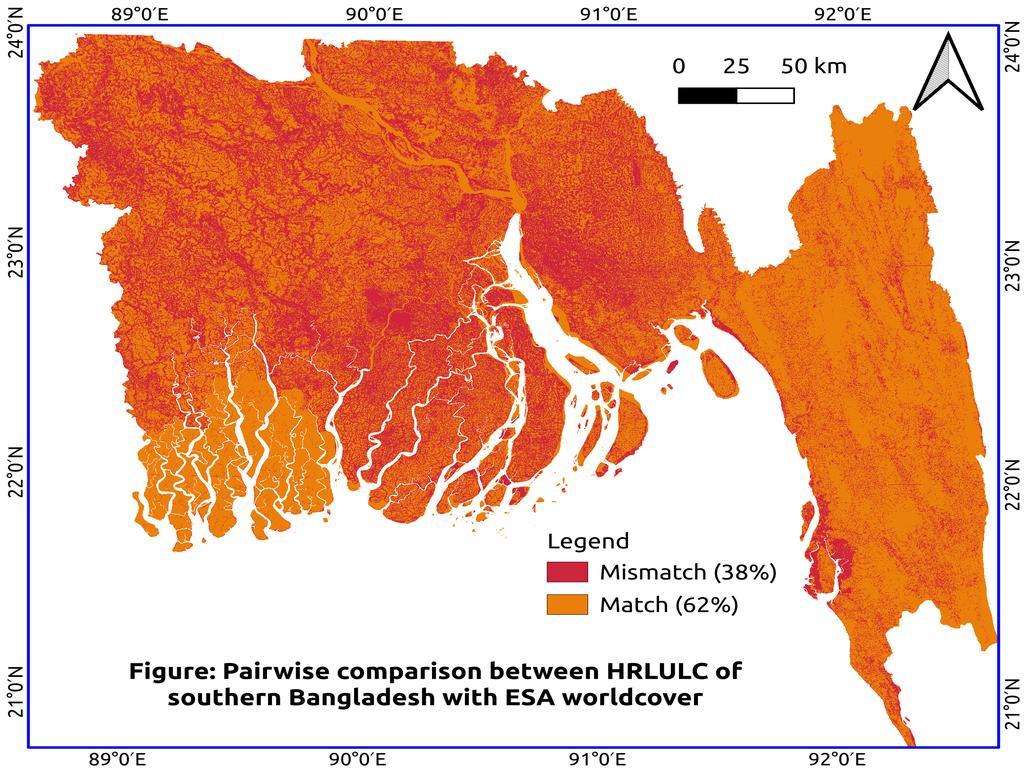
Pairwise Land Cover Comparison: HRLULC of Southern Bangladesh vs. ESA WorldCover Using QGIS
Land Use/Land Cover (LULC) maps are vital for tracking land transformation, environmental changes, and urban growth. With multiple global LULC products available — such as ESA WorldCover, ESRI Land Cover, JAXA, and custom classifications — comparing them is crucial for validating accuracy and identifying disagreement zones.
This guide shows how to compare LULC maps pixel-by-pixel in QGIS, visualize agreement/disagreement, and compute the percentage of matched pixels using two methods:
⚙️ Method 1: Use the Raster Calculator (Quick Comparison)
✅ Step 1: Prepare Your LULC Rasters
Make sure both rasters:
-
Use the same LULC classification scheme (e.g.,
1 = forest,2 = urban, etc.) -
Are properly aligned (same resolution, CRS, extent)
-
Are in categorical integer format, not RGB
🔄 Use
Raster → Align RastersorReclassify by tableif needed.
📐 Step 2: Compare Rasters Using Raster Calculator
Go to:
Raster → Raster Calculator
Enter this formula:
"your_map@1" = "other_map@1"
Example:
"lulc_custom@1" = "lulc_esa_2021@1"
-
This will return
1where the two maps agree on the LULC category -
And
0where they differ
💾 Save the output as something like: match_esa.tif
🧮 Step 3: Analyze Results Using Python Console
Open the Python Console:
Plugins → Python Console → Show Editor
Paste this code:
from qgis.core import QgsRaster, QgsProject

layer_name = 'match_esa'  # Change to your output layer name
layer = QgsProject.instance().mapLayersByName(layer_name)[0]
provider = layer.dataProvider()
block = provider.block(1, layer.extent(), layer.width(), layer.height())

hist = {}
for y in range(block.height()):
    for x in range(block.width()):
        val = block.value(x, y)
        if val != provider.sourceNoDataValue(1):
            hist[val] = hist.get(val, 0) + 1

total = sum(hist.values())
matches = hist.get(1, 0)
mismatches = hist.get(0, 0)

match_pct = (matches / total) * 100
mismatch_pct = (mismatches / total) * 100

print(f"Match: {matches} pixels ({match_pct:.2f}%)")
print(f"Mismatch: {mismatches} pixels ({mismatch_pct:.2f}%)")
You’ll get a percentage-based report like this:
Match: 64,499,184 pixels (52.03%)
Mismatch: 59,422,240 pixels (47.97%)
🧰 Method 2: Use the Processing Toolbox (More Flexible)
If you prefer using a GUI-based tool rather than writing formulas, try this:
✅ Step-by-Step:
-
Open the Processing Toolbox
Go to:Processing → Toolbox -
Search for the tool:
"Raster layer calculator" -
Double-click the tool and enter the following formula in the Expression box:
"your_map@1" = "other_map@1" -
Set the output file (e.g.,
match_esa.tif) and click Run
This tool does the same operation as Method 1 but with more flexibility — you can:
-
Select input layers from dropdowns
-
Control output CRS and extent
-
Chain it with other processing tools
🧭 Interpreting Results
The output raster contains:
-
1: where both maps assigned the same LULC class -
0: where they assigned different classes
This forms a binary agreement map useful for:
-
Visual inspection (with red for match, orange for mismatch)
-
Accuracy assessment
-
Reports and presentations


0% Positive Review (0 Comments)