Distribution Map in QGIS Using CSV Data
Geographic Information Systems (GIS) allow us to turn raw data into meaningful visual maps. If you're working with a CSV file containing latitude, longitude, and land cover category data (e.g., Built-up, Forest, Wetland), QGIS is a powerful and free tool for this task.
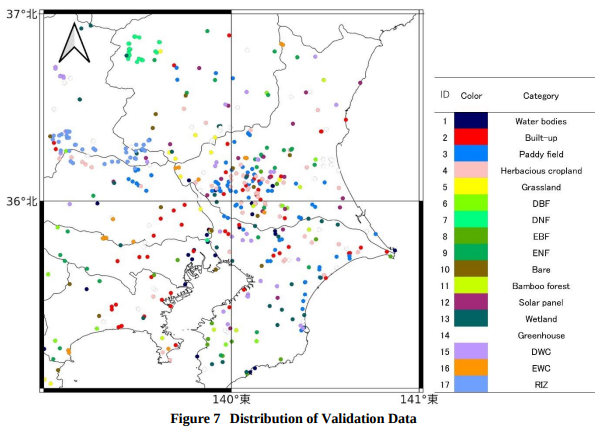
In this tutorial, we'll guide you step-by-step to create a categorically styled distribution map in QGIS — just like those seen in scientific publications.
🗂️ What You'll Need
-
QGIS (v3.x or later)
-
A CSV file with at least these columns:
-
Latitude -
Longitude -
Category_name(or similar)
-
Example row from your CSV:
Latitude,Longitude,Category_name
23.525432,92.247847,Built-up
📌 Step 1: Load Your CSV as a Point Layer
-
Open QGIS.
-
Go to Layer → Add Layer → Add Delimited Text Layer.
-
Browse and select your CSV file.
-
Set:
-
X field →
Longitude -
Y field →
Latitude -
Geometry CRS →
EPSG:4326(WGS 84)
-
-
Click Add → Your points should now appear on the map.
🎨 Step 2: Categorize by Land Use Type
-
In the Layers Panel, right-click on your new layer → Properties.
-
Go to the Symbology tab.
-
Change the renderer type to Categorized.
-
In the Value field, select
Category_name(or whatever your category column is named). -
Click Classify. This will generate color symbols for each unique category.
⚠️ If only one symbol appears, your data may have whitespace or case issues. Clean the CSV using a spreadsheet editor or a Python script that strips trailing spaces.
🎯 Step 3: Assign Custom Colors (Optional)
To match a specific legend (e.g., red for built-up, green for forest):
-
In the Symbology panel, double-click the color box next to each category.
-
Manually choose the color you want.
-
Use the same RGB codes from your project or publication.
Example color scheme:
| Category | Hex Code |
|---|---|
| Built-up | #E13200 |
| Water | #0000FF |
| Wetland | #2FFFFF |
| EF (Forest) | #276D1C |
🧭 Step 4: Add a Basemap (Optional)
-
Go to the Browser Panel.
-
Under XYZ Tiles, right-click and add OpenStreetMap or Esri World Imagery.
-
Drag the tile layer below your point layer in the Layers Panel.
🧭 Step 5: Add a North Arrow and Scale Bar
-
Go to Project → New Print Layout.
-
Add your map to the layout with the Add Map tool.
-
Use the Add North Arrow and Add Scale Bar tools from the top toolbar.
-
You can adjust placement, size, and style from the right panel.
📤 Step 6: Export the Final Map
-
In the Print Layout, go to Layout → Export as Image or Export as PDF.
-
Choose resolution (300 dpi for publication-quality).
-
Save the file.


0% Positive Review (0 Comments)